Analysis on Bicycle Sales for SimplyBusiness
SimplyBusiness is a sports bicycle retail company based in the United States, with distributors in countries such as the United Kingdom, Australia, Canada, Germany, and France. The company’s main activities involve retail through reseller stores or online sales via their website. Therefore, the company’s information systems record and process daily transactions of customer purchases in […]
SimplyBusiness is a sports bicycle retail company based in the United States, with distributors in countries such as the United Kingdom, Australia, Canada, Germany, and France. The company’s main activities involve retail through reseller stores or online sales via their website. Therefore, the company’s information systems record and process daily transactions of customer purchases in retail stores or online through the website.

Day 1: Building Data Knowledge on Company Processes and Activities
As we operate within the Sales Department, monitoring sales performance and devising strategies to boost sales growth is crucial. Therefore, we need a clear understanding of the company’s two main sales activities: 1) online sales through the website, and 2) retail sales through reseller stores.
In the online website sales activity, transactions occur when customers make purchases and complete orders through the website. Each sales order (Sales Order) is initiated by a specific customer, identified by an Order Number with order details such as the Order Date, estimated delivery date (Due Date), and actual delivery date (Ship Date).
Each order is executed in a different country (Sales Area), and sales figures are calculated in the currency (Currency) of that country. An order consists of multiple items (Product) corresponding to various categories (Order Line Item). Occasionally, the company implements specific promotional campaigns (Promotion) to stimulate customer purchases.
Similarly, in the Retail (Reseller) activity, orders are updated similarly to online sales through the website but include additional information about the reseller (Reseller) and salesperson (Employee).
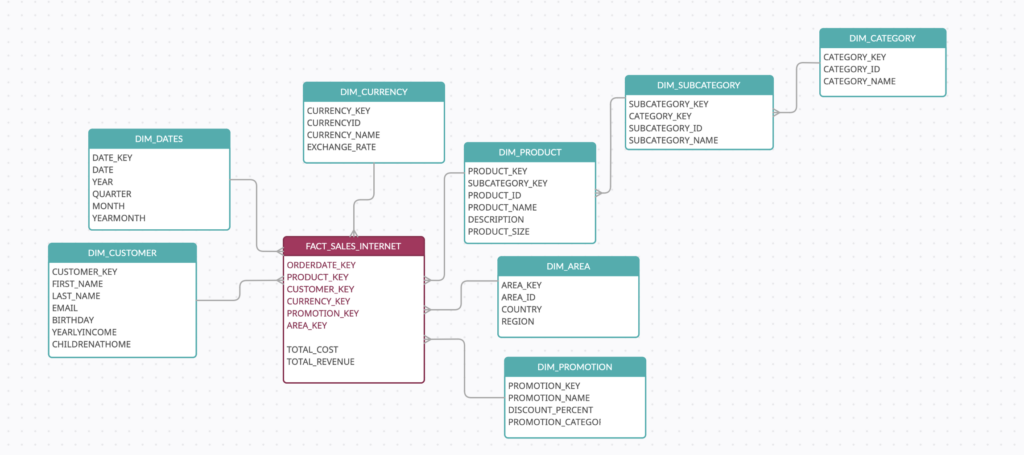
Below is a list of data tables that our boss wants us to review on the first day:
Database: DWH
Schema: RETAIL
Tables: Fact Tables: FACT_SALES_INTERNET
FACT_SALES_RESELLER
Dimension Tables:
DIM_CUSTOMER
DIM_PRODUCT
DIM_SUBCATEGORY
DIM_CATEGORY
DIM_AREA
DIM_CURRENCY
Day 2: Building a General Understanding of Company Business through Exploratory Data Analysis (EDA) and Descriptive Analysis
From our manager, we know that we need to focus on online sales as it is a core area for the company, with a specific emphasis on the U.S. market and orders in USD.
Firstly, let’s outline the metrics to serve our analysis:
- Total Revenue – Sales revenue in USD (Total Revenue)
- Number of Products Sold – The count of different products sold (Product Key)
- Number of Customers Sold – The count of different customers sold to (Customer Key)
- Number of Orders Sold – The count of orders that have been sold (Order Number)
- Number of Items Sold – The count of line items that have been sold (Order Line Item)
- Average Delivery Time (days) – The average delivery time in days between Order Date and Ship Date (Ship Date – Order Date)
- Total Net Profit – The total profit on products (Total Revenue – Total Cost)
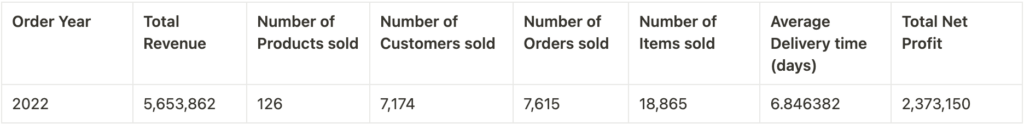
Let’s focus on the U.S. market (Area.Country = ‘United States’ and CurrencyID = ‘USD’) and write a query to find values for the mentioned measures in the year 2022 (based on Order Date).
SELECT OD.YEAR,
SUM(TOTALREVENUE) AS TOTAL_REVENUE_USD,
COUNT(DISTINCT PRODUCT_KEY) AS PRODUCTS_SOLD,
COUNT(DISTINCT CUSTOMER_KEY) AS CUSTOMERS_SOLD,
COUNT(DISTINCT ORDERNUMBER) AS ORDER_NUMBER,
COUNT(ORDERLINEITEM) AS ORDER_LINE_ITEM,
AVG(DATEDIFF(DAY, OD.DATE, SD.DATE)) AS AVERAGE_DELIVER_TIME,
SUM(TOTALREVENUE – TOTALCOST) AS TOTAL_NET_PROFIT
FROM FACT_SALES_INTERNET FSI
INNER JOIN DIM_DATES OD ON OD.DATE_KEY = FSI.ORDERDATE_KEY
INNER JOIN DIM_DATES SD ON SD.DATE_KEY = FSI.SHIPDATE_KEY
INNER JOIN DIM_AREA DA ON DA.AREA_KEY = FSI.AREA_KEY
INNER JOIN DIM_CURRENCY DC ON DC.CURRENCY_KEY = FSI.CURRENCY_KEY
WHERE
OD.YEAR = 2022 AND DA.COUNTRY = ‘United States’ AND DC.CURRENCYID = ‘USD’
GROUP BY 1;
Advanced
After describing the problem, let’s perform Diagnostic Analytics to delve deeper into the aspects identified in the descriptive analysis above.
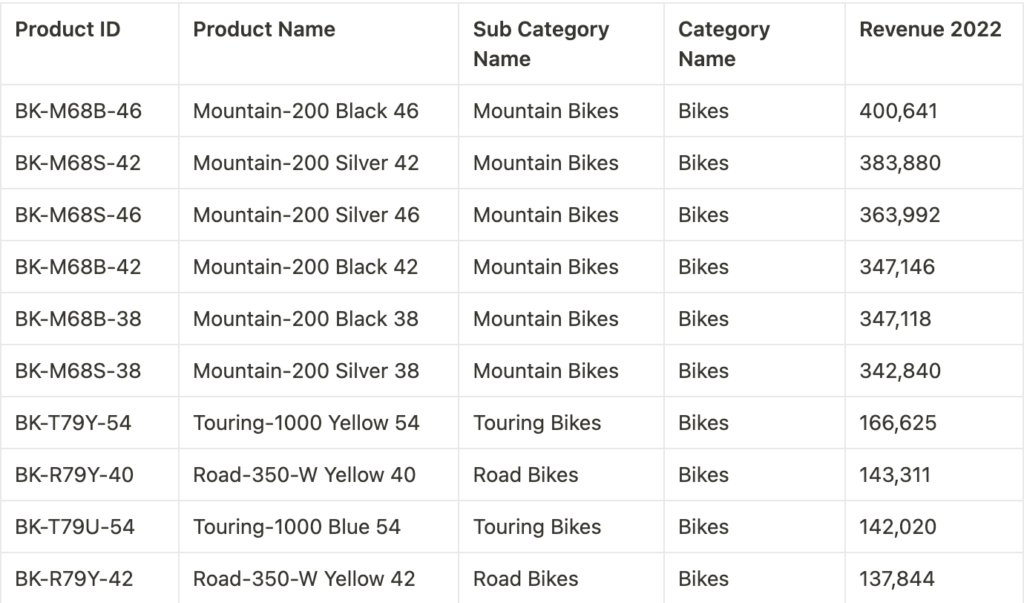
- List the names of the top 10 highest revenue-generating products in the year 2022.
SELECT TOP 10
DP.PRODUCTID AS PRODUCT_ID,
DP.PRODUCTNAME AS PRODUCT_NAME,
DS.SUBCATEGORYNAME AS SUBCATEGORY_NAME,
DCC.CATEGORYNAME AS CATEGORY_NAME,
SUM(FSI.TOTALREVENUE) AS REVENUE_2022
FROM FACT_SALES_INTERNET FSI
INNER JOIN DIM_PRODUCT DP ON DP.PRODUCT_KEY = FSI.PRODUCT_KEY
INNER JOIN DIM_SUBCATEGORY DS ON DS.SUBCATEGORY_KEY = DP.SUBCATEGORY_KEY
INNER JOIN DIM_CATEGORY DCC ON DCC.CATEGORY_KEY = DS.CATEGORY_KEY
INNER JOIN DIM_AREA DA ON DA.AREA_KEY = FSI.AREA_KEY
INNER JOIN DIM_CURRENCY DC ON DC.CURRENCY_KEY = FSI.CURRENCY_KEY
INNER JOIN DIM_DATES DD ON DD.DATE_KEY = FSI.ORDERDATE_KEY
WHERE
DD.YEAR = 2022 AND DA.COUNTRY = ‘United States’ AND DC.CURRENCYID = ‘USD’
GROUP BY 1,2,3,4
ORDER BY REVENUE_2022 DESC;
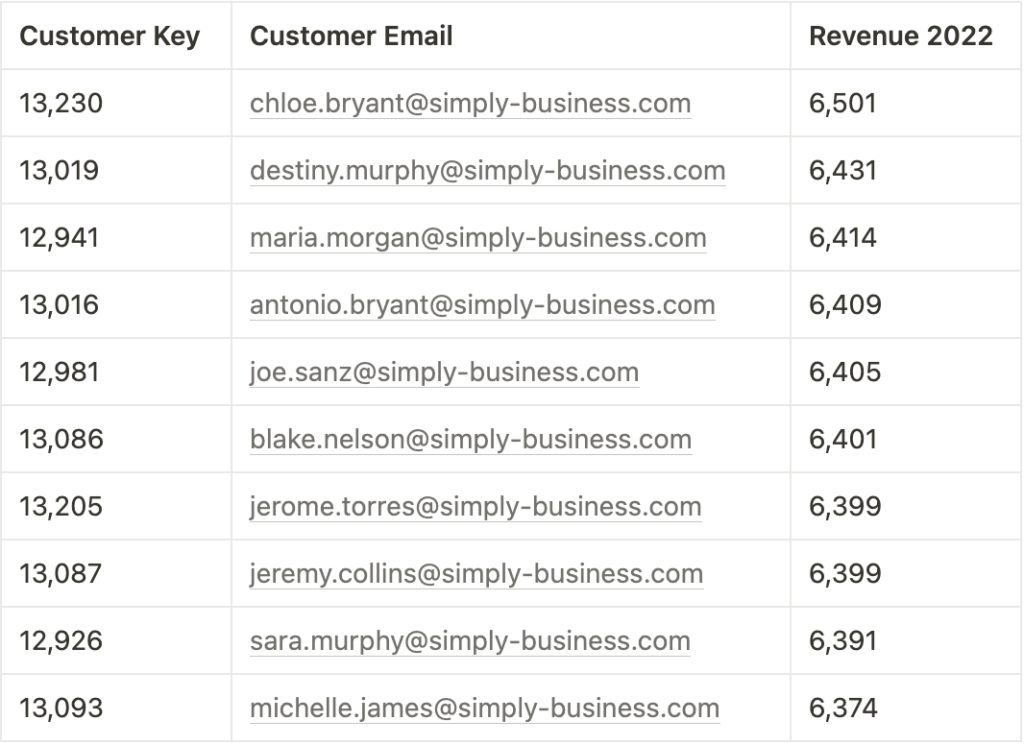
2. List the Customer Key and email of the top 10 customers with the highest purchase amounts in 2022.
SELECT TOP 10
DCU.CUSTOMER_KEY AS CUSTOMER_KEY,
DCU.EMAIL AS CUSTOMER_EMAIL,
SUM(FSI.TOTALREVENUE) AS REVENUE_2022
FROM FACT_SALES_INTERNET FSI
INNER JOIN DIM_CUSTOMERS DCU ON DCU.CUSTOMER_KEY = FSI.CUSTOMER_KEY
INNER JOIN DIM_AREA DA ON DA.AREA_KEY = FSI.AREA_KEY
INNER JOIN DIM_DATES DD ON DD.DATE_KEY = FSI.ORDERDATE_KEY
INNER JOIN DIM_CURRENCY DC ON DC.CURRENCY_KEY = FSI.CURRENCY_KEY
WHERE
DD.YEAR = 2022 AND DA.COUNTRY = ‘United States’ AND DC.CURRENCYID = ‘USD’
GROUP BY 1,2
ORDER BY REVENUE_2022 DESC;
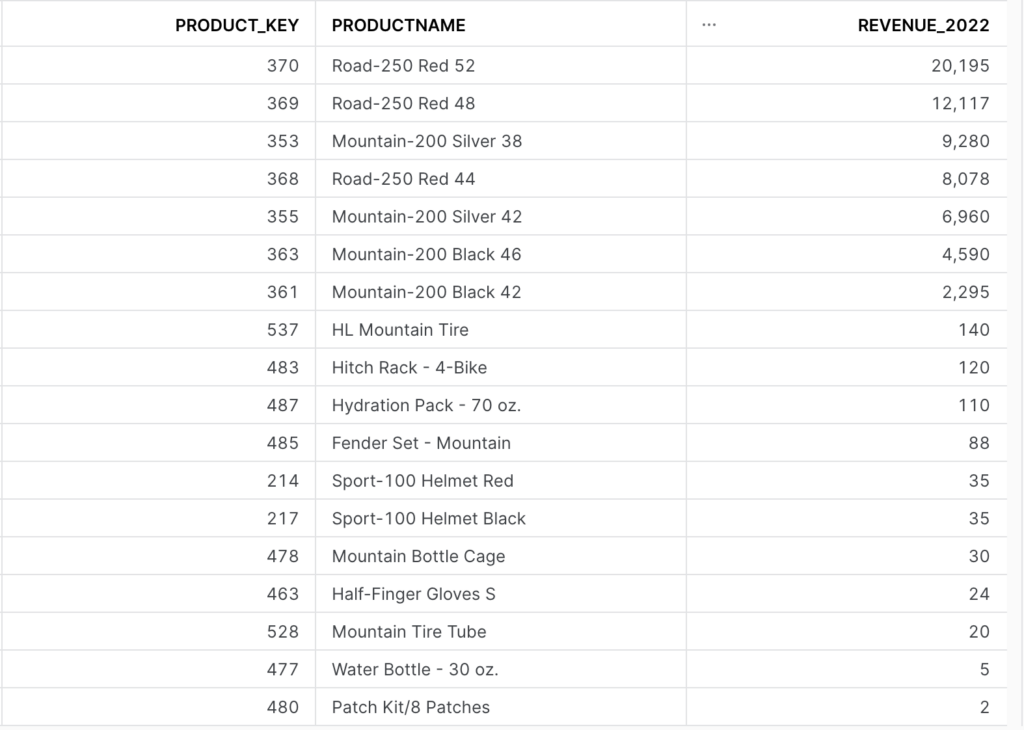
3. Based on the results from question 2, provide the list of products purchased by the top customers in 2022 and their respective sales figures.
WITH TOP_10_CUSTOMERS AS
(SELECT TOP 10
DCU.CUSTOMER_KEY AS CUSTOMER_KEY,
DCU.EMAIL AS CUSTOMER_EMAIL,
SUM(FSI.TOTALREVENUE)
FROM FACT_SALES_INTERNET FSI
INNER JOIN DIM_CUSTOMERS DCU ON DCU.CUSTOMER_KEY = FSI.CUSTOMER_KEY
INNER JOIN DIM_DATES DD ON DD.DATE_KEY = FSI.ORDERDATE_KEY
INNER JOIN DIM_AREA DA ON DA.AREA_KEY = FSI.AREA_KEY
INNER JOIN DIM_CURRENCY DC ON DC.CURRENCY_KEY = FSI.CURRENCY_KEY
WHERE DD.YEAR = 2022 AND DA.COUNTRY = ‘United States’ AND DC.CURRENCYID = ‘USD’
GROUP BY 1,2
ORDER BY SUM(FSI.TOTALREVENUE) DESC)
SELECT
DP.PRODUCT_KEY,
DP.PRODUCTNAME,
SUM(FSI.TOTALREVENUE) AS REVENUE_2022
FROM FACT_SALES_INTERNET FSI
INNER JOIN DIM_PRODUCT DP ON DP.PRODUCT_KEY = FSI.PRODUCT_KEY
INNER JOIN DIM_DATES DD ON DD.DATE_KEY = FSI.ORDERDATE_KEY
INNER JOIN DIM_AREA DA ON DA.AREA_KEY = FSI.AREA_KEY
INNER JOIN DIM_CURRENCY DC ON DC.CURRENCY_KEY = FSI.CURRENCY_KEY
INNER JOIN TOP_10_CUSTOMERS T10 ON T10.CUSTOMER_KEY = FSI.CUSTOMER_KEY
WHERE DD.YEAR = 2022 AND DA.COUNTRY = ‘United States’ AND DC.CURRENCYID = ‘USD’
GROUP BY 1,2
ORDER BY REVENUE_2022 DESC;
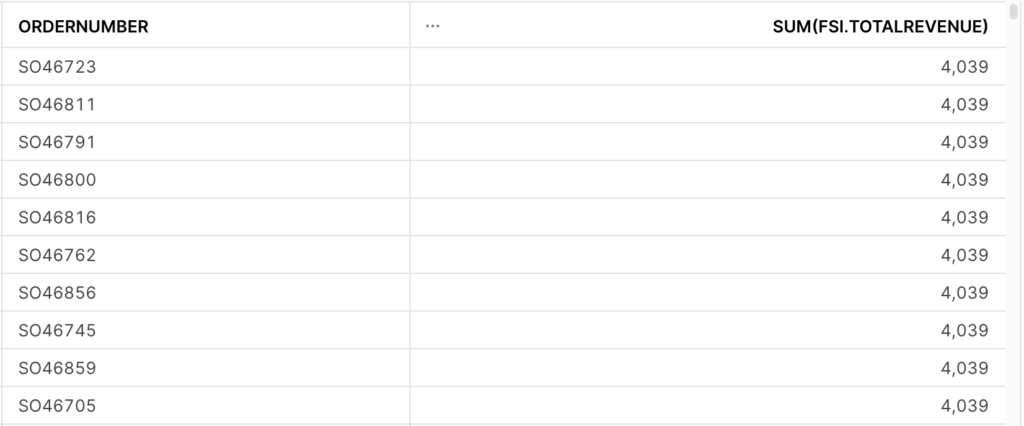
4A. Retrieve orders placed in the year 2022 with an order value exceeding 1,000 USD.
SELECT
FSI.ORDERNUMBER,
SUM(FSI.TOTALREVENUE)
FROM FACT_SALES_INTERNET FSI
INNER JOIN DIM_AREA DA ON DA.AREA_KEY = FSI.AREA_KEY
INNER JOIN DIM_CURRENCY DC ON DC.CURRENCY_KEY = FSI.CURRENCY_KEY
INNER JOIN DIM_DATES DD ON DD.DATE_KEY = FSI.ORDERDATE_KEY
WHERE DD.YEAR = 2022 AND DA.COUNTRY = ‘United States’ AND DC.CURRENCYID = ‘USD’
GROUP BY 1
HAVING SUM(FSI.TOTALREVENUE) > 1000
ORDER BY SUM(FSI.TOTALREVENUE) DESC;
4B. Based on the results from question 4A, provide the number of orders with a value exceeding 1,000 USD and the average total revenue of those orders.
WITH ORDER_TABLE AS
(SELECT
FSI.ORDERNUMBER,
SUM(FSI.TOTALREVENUE) REVENUE
FROM FACT_SALES_INTERNET FSI
INNER JOIN DIM_DATES DD ON DD.DATE_KEY = FSI.ORDERDATE_KEY
INNER JOIN DIM_AREA DA ON DA.AREA_KEY = FSI.AREA_KEY
INNER JOIN DIM_CURRENCY DC ON DC.CURRENCY_KEY = FSI.CURRENCY_KEY
WHERE DD.YEAR = 2022 AND DA.COUNTRY = ‘United States’ AND DC.CURRENCYID = ‘USD’
GROUP BY 1
HAVING SUM(FSI.TOTALREVENUE) > 1000)
SELECT
COUNT(DISTINCT ORDERNUMBER) AS NUMBER_OF_ORDER,
AVG(REVENUE) AS AVERAGE_REVENUE,
SUM(REVENUE) AS REVENUE_2022
FROM ORDER_TABLE;

Day 3: Analyzing the Company’s Reseller Retail Operations
In the retail (Reseller) activity, the names of sales employees are recorded for each order. The company has a policy to reward outstanding sales employees (bonus = 0.1% of the annual sales revenue).
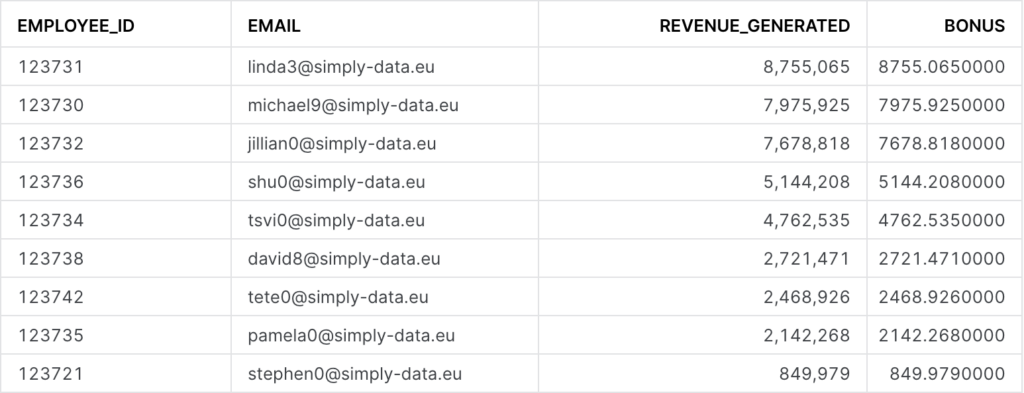
5. List the names of the top 10 sales employees with the highest sales revenue in the year, the achieved sales revenue, and the bonus for the year 2022 in the U.S. market.
SELECT TOP 10
DE.EMPLOYEE_ID,
DE.EMAIL,
SUM(FSR.TOTALREVENUE) AS REVENUE_GENERATED,
SUM(FSR.TOTALREVENUE) * 0.1/100 AS BONUS
FROM FACT_SALES_RESELLER FSR
INNER JOIN DIM_EMPLOYEE DE ON DE.EMPLOYEE_KEY = FSR.EMPLOYEE_KEY
INNER JOIN DIM_DATES DD ON DD.DATE_KEY = FSR.ORDERDATE_KEY
INNER JOIN DIM_AREA DA ON DA.AREA_KEY = FSR.AREA_KEY
INNER JOIN DIM_CURRENCY DC ON DC.CURRENCY_KEY = FSR.CURRENCY_KEY
WHERE DD.YEAR = 2022 AND DA.COUNTRY = ‘United States’ AND DC.CURRENCYID = ‘USD’
GROUP BY 1,2
ORDER BY SUM(FSR.TOTALREVENUE) DESC;
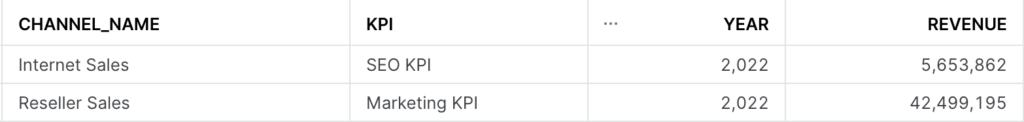
6. Summarize the revenue for the year 2022, the U.S. market, and USD, and create a View with the following structure:
CREATE OR REPLACE VIEW <tên của bạn_channel_sales_by_year> AS
(
SELECT FROM
)
CREATE VIEW UYEN_CHANNEL_SALES_BY_YEAR AS
(WITH RESELLER_TABLE AS
(SELECT ‘Reseller sales’ AS CHANNEL_NAME,
‘Marketing KPI’ AS KPI,
DD.YEAR,
SUM(FSR.TOTALREVENUE) AS REVENUE_2022
FROM FACT_SALES_RESELLER FSR
INNER JOIN DIM_DATES DD ON DD.DATE_KEY = FSR.ORDERDATE_KEY
INNER JOIN DIM_AREA DA ON DA.AREA_KEY = FSR.AREA_KEY
INNER JOIN DIM_CURRENCY DC ON DC.CURRENCY_KEY = FSR.CURRENCY_KEY
WHERE DD.YEAR = 2022 AND DA.COUNTRY = ‘United States’ AND DC.CURRENCYID = ‘USD’
GROUP BY 1,2,3
),
INTERNET_TABLE AS
(SELECT ‘Internet sales’ AS CHANNEL_NAME,
‘SEO KPI’ AS KPI,
DD.YEAR,
SUM(FSI.TOTALREVENUE) AS REVENUE_2022
FROM FACT_SALES_INTERNET FSI
INNER JOIN DIM_DATES DD ON DD.DATE_KEY = FSI.ORDERDATE_KEY
INNER JOIN DIM_AREA DA ON DA.AREA_KEY = FSI.AREA_KEY
INNER JOIN DIM_CURRENCY DC ON DC.CURRENCY_KEY = FSI.CURRENCY_KEY
WHERE DD.YEAR = 2022 AND DA.COUNTRY = ‘United States’ AND DC.CURRENCYID = ‘USD’
GROUP BY 1,2,3
)
SELECT * FROM RESELLER_TABLE
UNION ALL
SELECT * FROM INTERNET_TABLE);
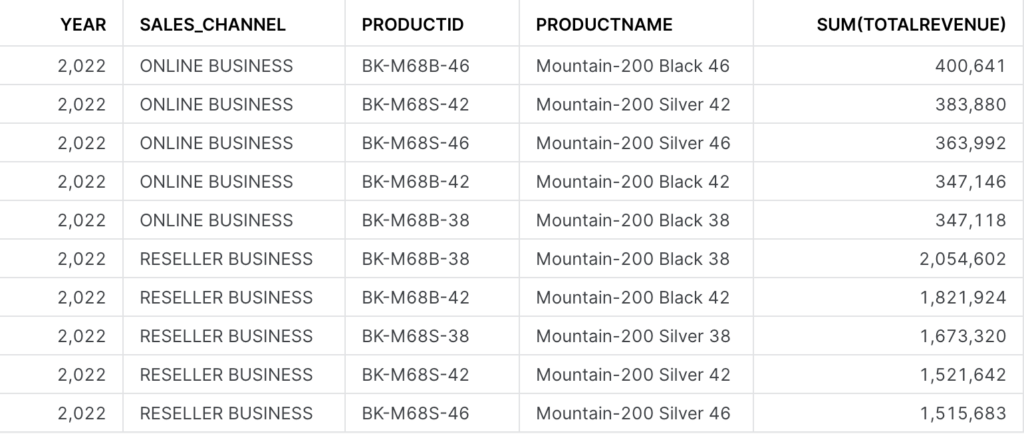
CREATE OR REPLACE VIEW <tên của bạn_top5product_by_channel> AS
(
SELECT FROM
)
CREATE VIEW UYEN_TOP5PRODUCT_BY_CHANNEL AS
(WITH TOP_5_RESELLER AS
(SELECT TOP 5
‘Reseller sales’ AS CHANNEL_NAME,
DD.YEAR,
DP.PRODUCTID AS PRODUCT_ID,
DP.PRODUCTNAME AS PRODUCT_NAME,
SUM(FSR.TOTALREVENUE) AS REVENUE_2022
FROM FACT_SALES_RESELLER FSR
INNER JOIN DIM_DATES DD ON DD.DATE_KEY = FSR.ORDERDATE_KEY
INNER JOIN DIM_AREA DA ON DA.AREA_KEY = FSR.AREA_KEY
INNER JOIN DIM_CURRENCY DC ON DC.CURRENCY_KEY = FSR.CURRENCY_KEY
INNER JOIN DIM_PRODUCT DP ON DP.PRODUCT_KEY = FSR.PRODUCT_KEY
WHERE DD.YEAR = 2022 AND DA.COUNTRY = ‘United States’ AND DC.CURRENCYID = ‘USD’
GROUP BY 1,2,3,4)
,TOP_5_ONLINE AS
(SELECT TOP 5
‘Online sales’ AS CHANNEL_NAME,
DD.YEAR,
DP.PRODUCTID AS PRODUCT_ID,
DP.PRODUCTNAME AS PRODUCT_NAME,
SUM(FSI.TOTALREVENUE) AS REVENUE_2022
FROM FACT_SALES_INTERNET FSI
INNER JOIN DIM_DATES DD ON DD.DATE_KEY = FSI.ORDERDATE_KEY
INNER JOIN DIM_AREA DA ON DA.AREA_KEY = FSI.AREA_KEY
INNER JOIN DIM_CURRENCY DC ON DC.CURRENCY_KEY = FSI.CURRENCY_KEY
INNER JOIN DIM_PRODUCT DP ON DP.PRODUCT_KEY = FSI.PRODUCT_KEY
WHERE DD.YEAR = 2022 AND DA.COUNTRY = ‘United States’ AND DC.CURRENCYID = ‘USD’
GROUP BY 1,2,3,4)
SELECT * FROM TOP_5_RESELLER
UNION ALL
SELECT * FROM TOP_5_ONLINE);